Helpful Info
Investors
Latest Performance
For details, please refer to "Consolidated Financial Results for the Fiscal Year Ended March 31, 2026".
Consolidated Financial Results for the Fiscal Year Ended March 31, 2026 (April 1, 2025 to March 31, 2026)
Consolidated operating results (Percentage figures denote YoY changes)
| (Unit: Millions of yen) | Fiscal year ended March 31, 2025 | Fiscal year ended March 31, 2026 | Percentages change (%) |
|---|---|---|---|
| Net sales | 140,581 | 174,142 | 23.9% |
| Operating profit | 15,295 | 17,455 | 14.1% |
| Ordinary profit | 16,462 | 17,751 | 7.8% |
| Profit attributable to owners of parent | 11,158 | 13,050 | 17.0% |

Consolidated balance sheets (summary)
| (Unit: Millions of yen) | Year ended March 31, 2025 (As of March 31, 2025) |
Year ended March 31, 2026 (As of March 31, 2026) |
Increase / Decrease |
|---|---|---|---|
| Assets | |||
| Total current assets | 69,841 | 74,083 | 4,242 |
| Total non-current assets | 29,112 | 29,276 | 163 |
| Total assets | 98,953 | 103,360 | 4,406 |
| Liabilities | |||
| Total current liabilities | 26,770 | 24,815 | (1,955) |
| Total non-current liabilities | 15,935 | 12,357 | (3,577) |
| Total liabilities | 42,706 | 37,173 | (5,532) |
| Net assets | |||
| Total net assets | 56,247 | 66,187 | 9,939 |
| Total liabilities and net assets | 98,953 | 103,360 | 4,406 |
Consolidated statement of cash flows (summary)
| (Unit: Millions of yen) | Fiscal year ended March 31, 2025 | Fiscal year ended March 31, 2026 | Increase / Decrease |
|---|---|---|---|
| Cash flows from operating activities | 7,779 | 7,477 | (301) |
| Cash flows from investing activities | 1,100 | (2,315) | (3,416) |
| Cash flows from financing activities | (13,520) | (5,195) | 8,325 |
| Effect of exchange rate change on cash and cash equivalents | (18) | 14 | 33 |
| Net increase (decrease) in cash and cash equivalents | (4,660) | (18) | 4,641 |
| Cash and cash equivalents at beginning of period | 34,814 | 30,854 | (3,959) |
| Increase in cash and cash equivalents resulting from inclusion of subsidiaries in consolidation | 700 | - | (700) |
| Cash and cash equivalents at end of period | 30,854 | 30,835 | (18) |
1. Qualitative Information on Financial Results
(1) Financial results
During the fiscal year under review, the Japanese economy maintained a moderate recovery trend, supported by a pickup in personal consumption and capital investment, although some issues remained, such as persistently high prices. Regarding the overseas economy, while uncertainties stemming from geopolitical risks and policy trends persist, a swift stabilization of the situation is highly anticipated. Under these economic conditions, the entertainment and content market, our focus area, is becoming increasingly vitalized. With government support further boosting the global attention on Japanese IP, we are seeing the emergence of companies capturing global business opportunities for growth, as well as those attracting high expectations by launching new IP-driven business initiatives.
With Tsuburaya Productions Co., Ltd. (TPD), a veteran in the IP industry, as one of our core companies, the Group has remained committed to our philosophy, The Greatest Leisure for All People. To effectively convert this momentum into revenue, we have simultaneously reinforced our operational base and channeled investments into growth sectors, consistently executing strategies aimed at sustainable growth and the creation of long-term corporate value.
As the driving force of our amusement equipment business, FIELDS CORPORATION has solidified its market presence and expanded its market share by continuously providing pachinko/pachislot (PS) machines that align with the needs of pachinko parlor operators. Reflecting these business environments and the progress of various initiatives, the Group’s consolidated results for the fiscal year under review were as follows: net sales ¥174,142 million (up 23.9% YoY), operating profit ¥17,455 million (up 14.1% YoY), ordinary profit ¥17,751 million (up 7.8% YoY), and profit attributable to owners of parent ¥13,050 million (up 17.0% YoY).
The overview of each business segment is as follows.
Content and Digital Business Segment
The status of TPD during the fiscal year under review is as follows.
In the Japanese business, sales increased compared with the same period of the previous fiscal year, driven by generally firm growth across all major categories, including licensing, MD (merchandising), and imaging and event revenues. As part of the commemorative initiatives for the Ultraman Series 60th Anniversary, we are actively collaborating with IP holders supported by diverse customer bases to further penetrate the Ultraman brand across a wide range of demographics.
As a result, domestic net sales reached ¥5,003 million (up 6.4% YoY).
Regarding overseas operations, revenue and profits declined year-on-year. However, Ultraman retains a high level of recognition and a strong fanbase in the Chinese market, and we believe that its medium- to long-term growth potential remains unchanged. Through the strengthening of strategic partnerships with our most trusted licensees, the Group is steadily advancing initiatives to expand into new categories in licensing and merchandising.
As a result, overseas net sales totaled ¥4,349 million (down 36.6% YoY).
<Revenue Breakdown by Region (Domestic and Overseas)>
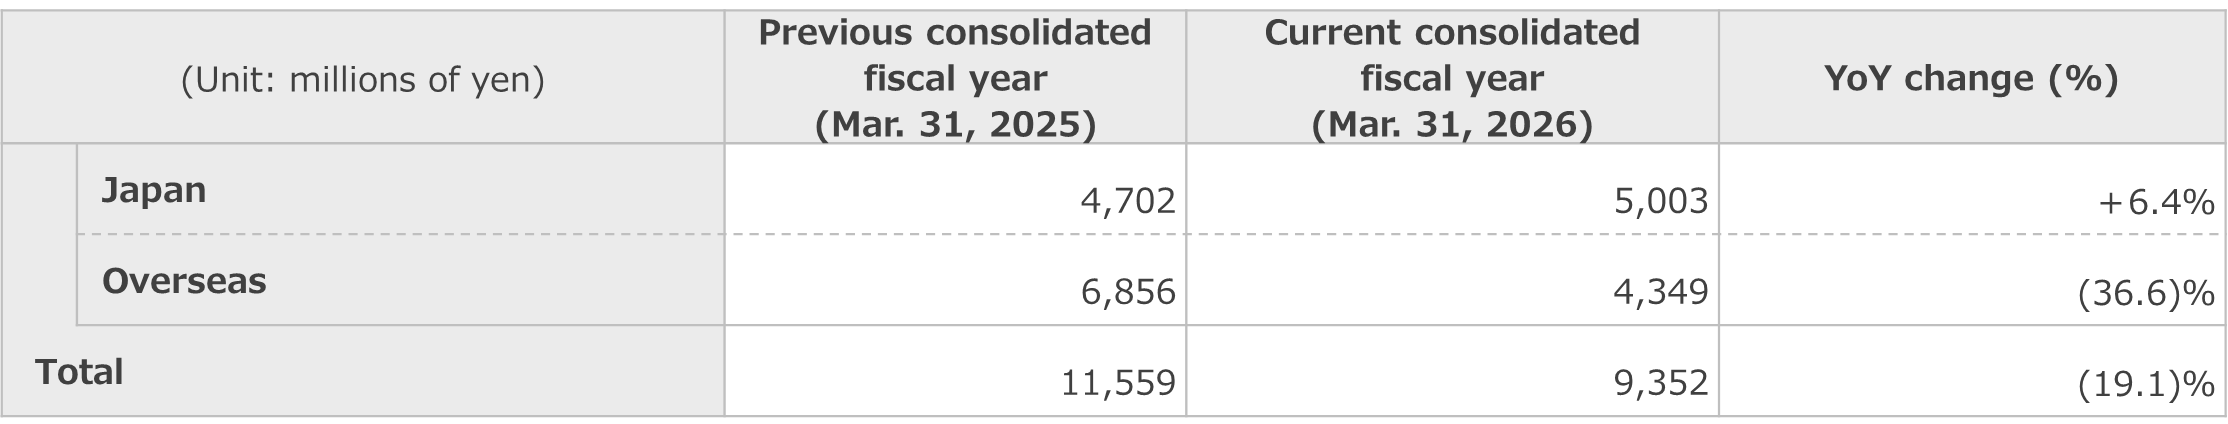
As a result, net sales totaled ¥9,352 million (down 19.1% YoY) in the fiscal year under review.
The breakdown by category is as follows.
<License Revenue: ¥4,159 million (down 39.2% YoY)>
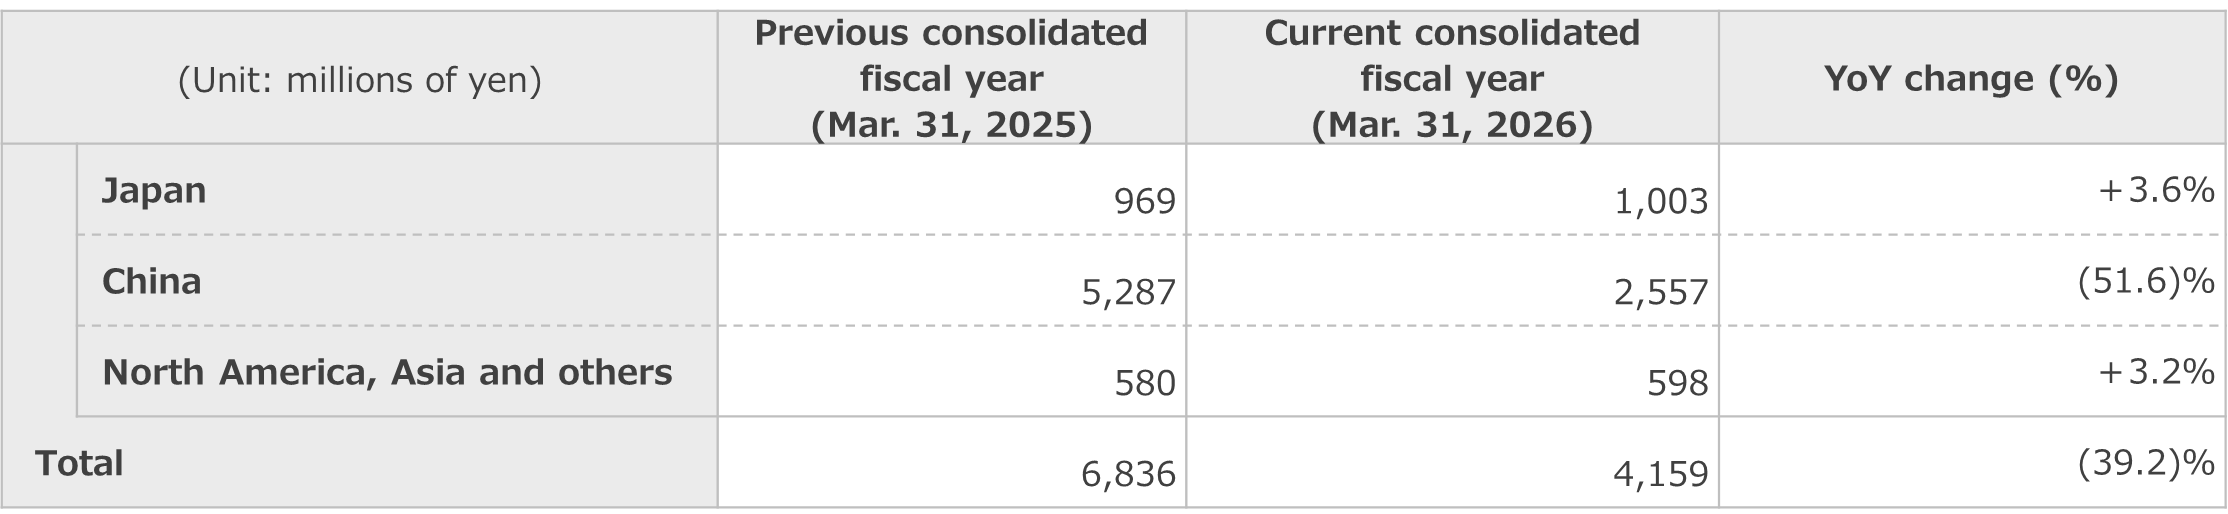
In the Japanese market, the Ultraman Series 60th Anniversary Project has made steady progress. As the anniversary period enters its full-scale launch phase, we will accelerate multifaceted exposure through these diverse partnerships, aiming to further enhance the added value of Ultraman. In the Chinese market, licensing revenue declined, however, the imaging and event segment recorded revenue growth, driven by robust performance in streaming distribution and the success of events and new ticketed stage performances in Shanghai.
<Imaging and Event Revenue: ¥2,964 million (up 1.0% YoY)>
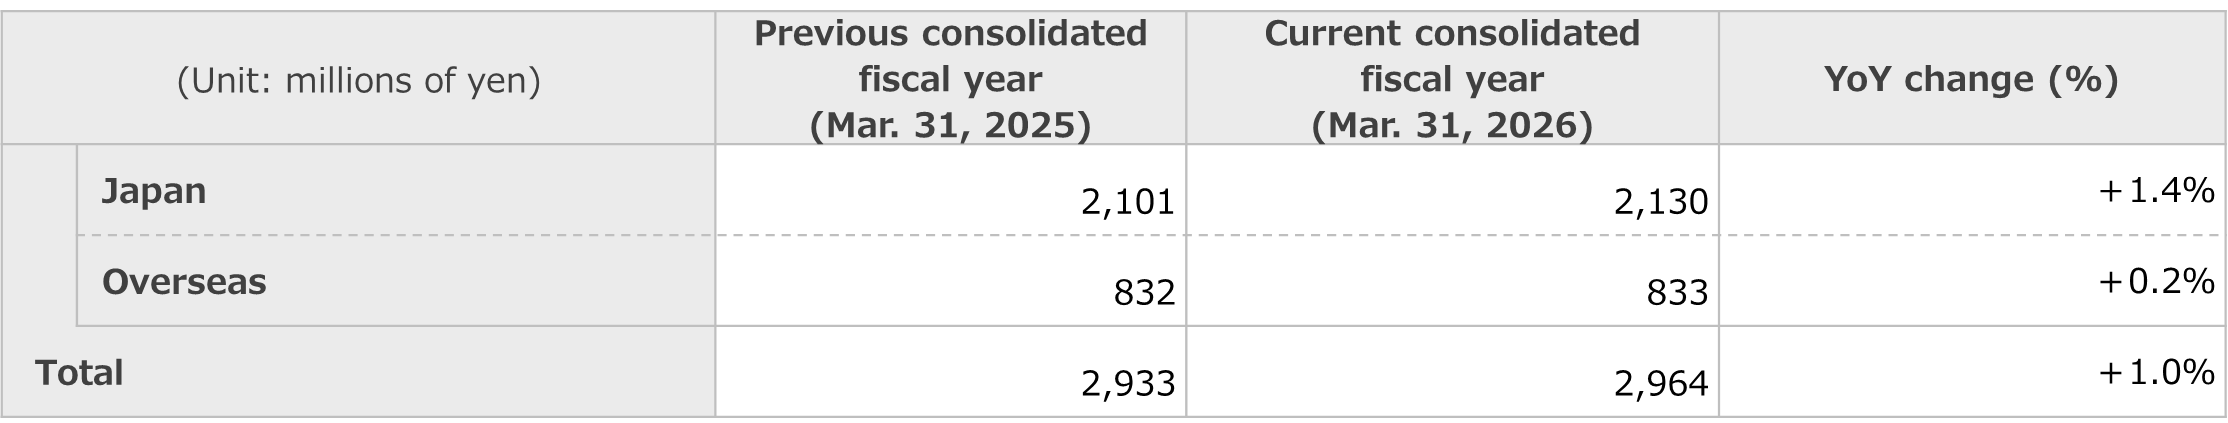
Revenue from imaging and event operations was roughly in line with the previous year during the fiscal year, primarily due to an increase in audience attendance at the biennial “TSUBURAYA CONVENTION 2025” held in fall and the annual “Ultra Heroes EXPO2025” (held in summer and winter).
As a result, net sales for the content and digital business segment was ¥13,874 million (down 15.4% YoY), and operating profit was ¥934 million (down 67.0% YoY).
Amusement Equipment Business Segment
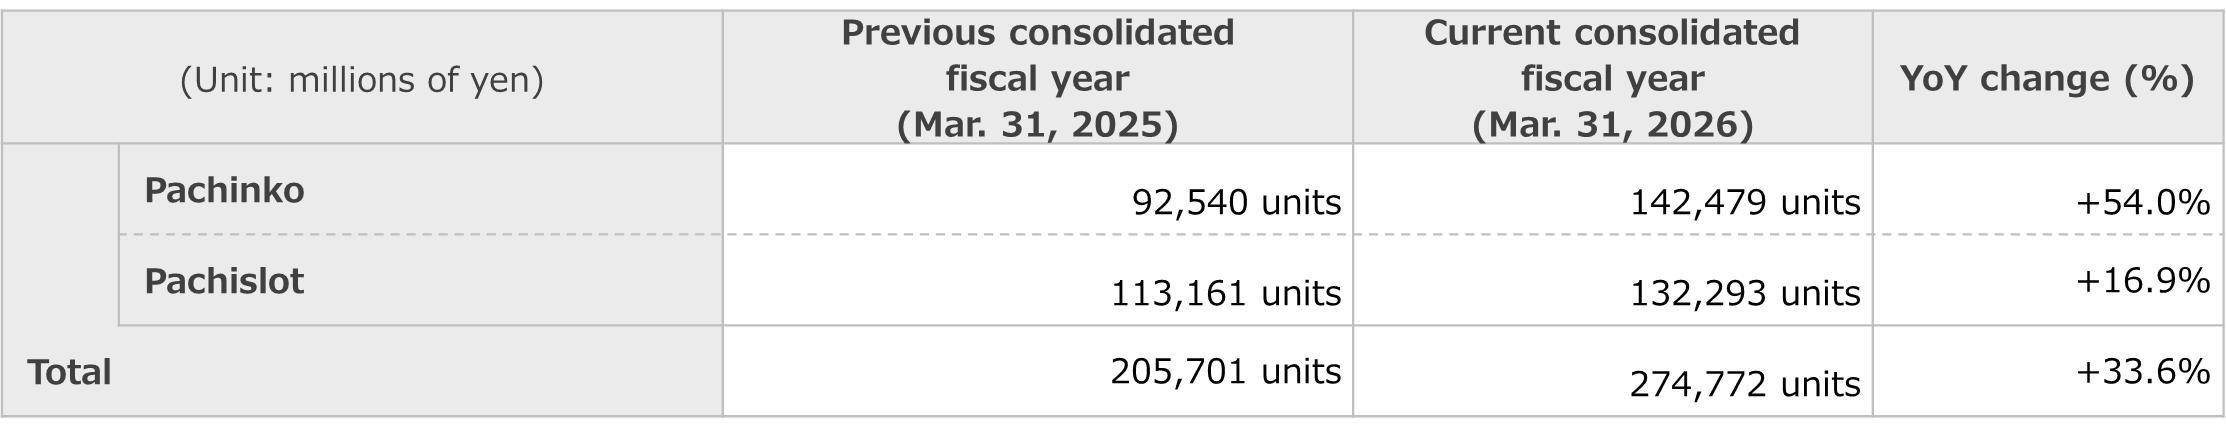
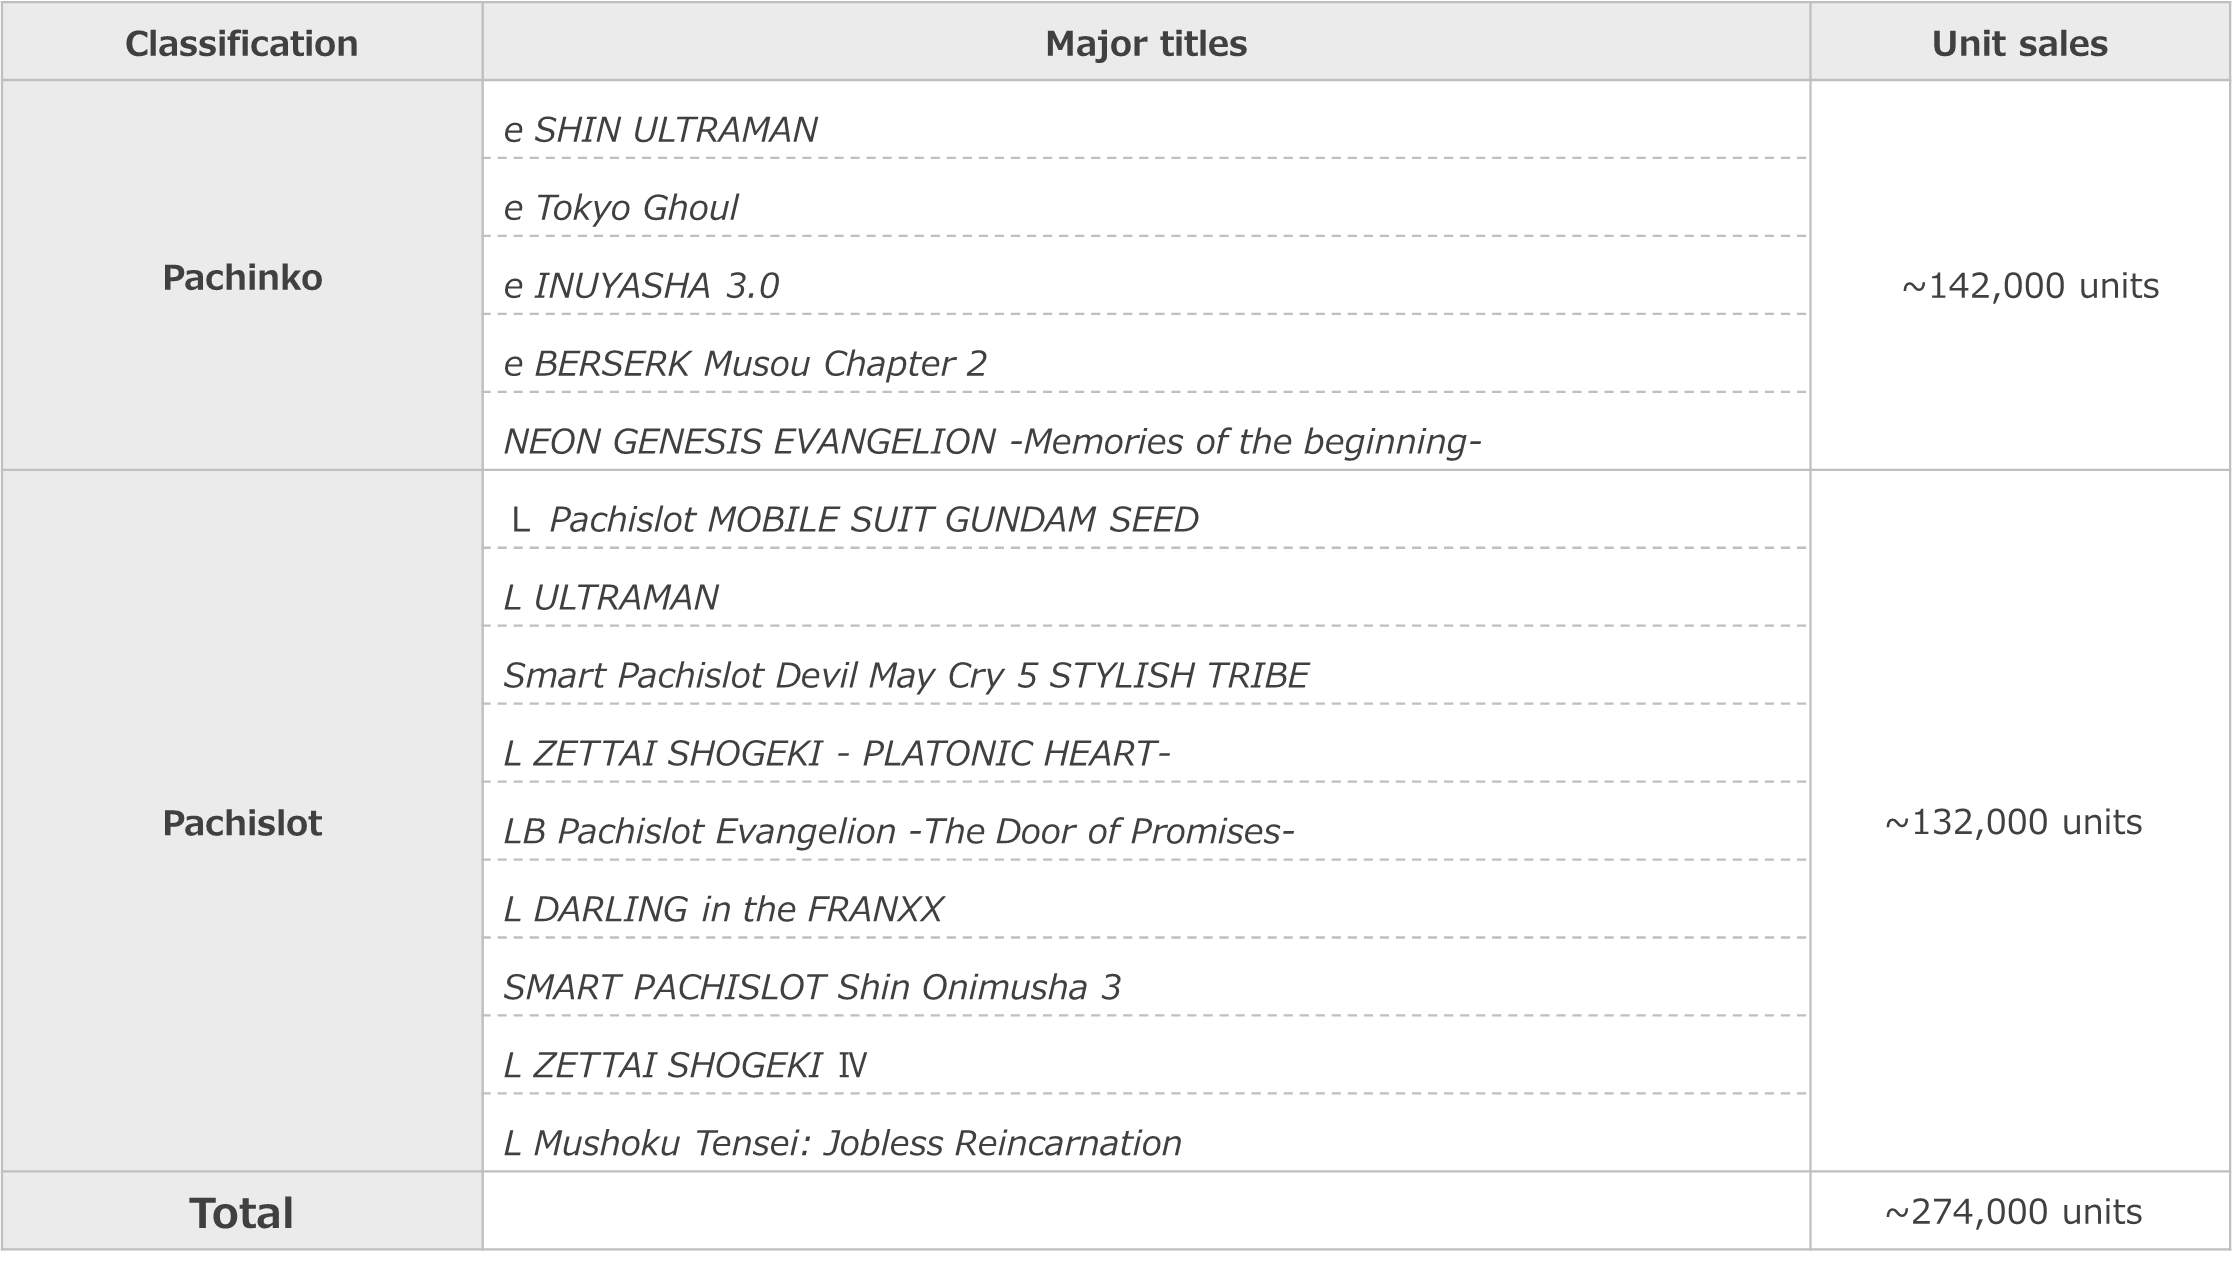
During the fiscal year under review, sales of pachinko and pachislot (PS) machines reached approximately 274,000 units (up 33.6% YoY), driven by strong sales of multiple titles featuring leading IPs, such as NEON GENESIS EVANGELION -Memories of the beginning-. Additionally, we responded to ongoing demand for increased production of L Tokyo Ghoul throughout the year. As a result, our share of market unit sales in fiscal year 2025 (Apr. 2025-Mar. 2026) was approximately 18.2% (according to our survey).
Furthermore, we implemented various initiatives to help pachinko parlors maximize customer traffic, such as proposing the installation of dedicated prize corners in stores that introduced our machine models.
As a result, strong sales of major titles and an expansion in market share, the amusement equipment business segment’s net sales were ¥159,069 million (up 29.2% YoY) and operating profit was ¥19,881 million (up 30.1% YoY).
[Major Titles Sold in the Fiscal Year Under Review]
Other Businesses
Other businesses posted net sales of ¥1,783 million and operating profit of ¥39 million for the fiscal year under review.
(2) Earnings Forecasts
In the entertainment and content market, which constitutes the core business domain of our Group, changes in the market environment are expected to accelerate further against the backdrop of increasingly diversified customer lifestyles and preferences, as well as ongoing technological advancements. To capture these environmental changes and rebuild our business model into a more robust one, the Group has formulated a three-year medium-term management plan starting from the fiscal year ending March 31, 2027.
The Group’s greatest strength is the strong fan base of Ultraman across Asia. At the same time, we have taken seriously the shortfall against the profit targets under the previous medium-term management plan and closely examined the underlying factors.
We recognize that entertainment demand in the domestic market remains resilient and that there continues to be significant potential for multifaceted development leveraging our IP. While the gross retail sales value for Ultraman in the domestic character merchandise market has achieved steady growth, a significant gap remains compared to the Chinese market, which has already seen a breakthrough. In China, the estimated retail sales value for Ultraman from 2022 to 2025 ranged between ¥150,000 million and ¥250,000 million; in contrast, the domestic market remains at approximately ¥15,000 million (estimated). Most domestic and international IP holders generally see sales in their home market that are two to three times larger than their sales in the Chinese market. Compared to this benchmark, Ultraman stands at about one-tenth, leading us to recognize the low domestic retail sales value as a key challenge. To raise the domestic market to levels comparable with China, we will learn extensively from our Chinese licensees while formulating uniquely Japanese strategies and building a new business model.
Regarding the Chinese market, while revenue has declined for the first time in the past 10 years (on a calendar-year basis), we will solidify our business foundation and aim to maintain and expand earnings by further strengthening collaboration with our local partners. As a result of these efforts, we have already secured seven new license agreements as of April.
In the future, by leveraging the supply chains and deployment capabilities in Asia that we have built through the development of our own IP, we aim to establish ourselves as an “IP growth platformer” capable of supporting the cultivation and expansion of third-party IP as well, thereby pursuing further enhancement of corporate value.
In the amusement equipment business, we will continue striving to provide attractive gaming machines that meet the expectations of pachinko halls by expanding the fan base, including younger demographics, through the utilization of diverse IP, while further accelerating our development structure through the proactive adoption of advanced technologies.
For the fiscal year ending March 31, 2027, we forecast consolidated net sales of ¥187,000 million and consolidated operating profit of ¥19,000 million through the steady execution of the initiatives set forth in this medium-term management plan (amusement equipment business: net sales of ¥170,000 million and operating profit of ¥20,000 million; content and digital business: net sales of ¥15,300 million and operating profit of ¥3,000 million).
Through the steady implementation of the initiatives set forth in this medium-term management plan, we will ensure sustainable growth and, as one unified Group, strive to enhance corporate value. Going forward, we will continue to carefully monitor the economic environment and market trends, and if any event arises that may have a material impact on our business performance, we will endeavor to disclose such information promptly and appropriately.
(2) Basic Policy on Profit Distribution and Dividends for the Current and Next Fiscal Years
As per our basic policy on the distribution of profits, we regard the improvement of corporate value as an important management issue and have adopted a basic policy of paying dividends in line with profits.
As a Group engaged in a global content business, we recognize that continuous investment is essential for sustainable growth. Based on this philosophy, we intend to aggressively reinvest cash generated from steady profit growth into the structural reform of our IP businesses to further enhance corporate value.
Going forward, we will strive to provide stable and continuous shareholder returns including dividends, while maintaining a careful balance between business investment for future growth and steady profit increases.
Dividends for the current and next fiscal years
Regarding the year-end dividend for the fiscal year ended March 31, 2026, we have decided to increase the dividend by 20 yen from the previous forecast of 50 yen, resulting in a revised dividend of 70 yen per share. This decision was made to further strengthen shareholder returns, based on a comprehensive review of the above policy and recent steady financial performance. This proposal will be submitted to the 38th Annual General Meeting of Shareholders scheduled for June 17, 2026.
Furthermore, for the next fiscal year's dividend forecast, we plan to pay a year-end dividend of 70 yen per share (unchanged from the current fiscal year), reflecting our strong commitment to business growth and our ongoing proactive stance on shareholder returns.
(Note 1) Figures in this summary report are based on published figures for each company/organization or on our estimates.
(Note 2) The names of products in this summary report are trademarks or registered trademarks of their respective companies.
(4) Overview of Financial Position
- Assets
Current assets increased by ¥4,242 million from the end of the previous fiscal year to ¥74,083 million. This was mainly due to an increase in work in process and merchandising rights.
Property, plant and equipment increased by ¥635 million from the end of the previous fiscal year to ¥10,866 million. This was mainly due to an increase in tools, furniture and fixtures.
Intangible assets decreased by ¥302 million from the end of the previous fiscal year to ¥1,813 million. This was mainly due to a decrease in goodwill.
Investments and other assets decreased by ¥169 million from the end of the previous fiscal year to ¥16,596 million.
As a result, assets increased by ¥4,406 million from the end of the previous fiscal year to ¥103,360 million. - Liabilities
Current liabilities decreased by ¥1,955 million from the end of the previous fiscal year to ¥24,815 million. This was mainly due to a decrease in trade payables.
Non-current liabilities decreased by ¥3,577 million from the end of the previous fiscal year to ¥12,357 million. This was mainly due to a decline in long-term borrowings.
As a result, liabilities decreased by ¥5,532 million from the end of the previous fiscal year to ¥37,173 million. - Net assets
Net assets increased by ¥9,939 million from the end of the previous fiscal year to ¥66,187 million. This was mainly due to growth in retained earnings.
(5) Overview of Cash Flows for the Fiscal Year Under Review
Cash and cash equivalents (hereinafter, “cash”) at the end of the fiscal year under review decreased by ¥18 million from the end of the previous fiscal year to ¥30,835 million.
Cash flows for the fiscal year under review are summarized as follows:
- Cash flows from operating activities
Net cash provided by operating activities amounted to ¥7,477 million (¥7,779 million provided in the same period of the previous fiscal year). This was mainly due to profit before income taxes of ¥17,303 million, an increase in inventories of ¥12,495 million, income taxes paid of ¥3,367 million, and depreciation of ¥1,851 million. - Cash flows from investing activities
Net cash used in investing activities amounted to ¥2,315 million (¥1,100 million provided in the same period of the previous fiscal year). This was mainly due to purchase of property, plant and equipment of ¥2,131 million and payments for loans receivable of ¥402 million. - Cash flows from financing activities
Net cash used in financing activities amounted to ¥5,195 million (¥13,520 million used in the same period of the previous fiscal year). This was mainly due to dividends paid of ¥3,108 million and repayments of long-term borrowings of ¥2,207 million.