Helpful Info
Investors
Financial Highlights (Consolidated)
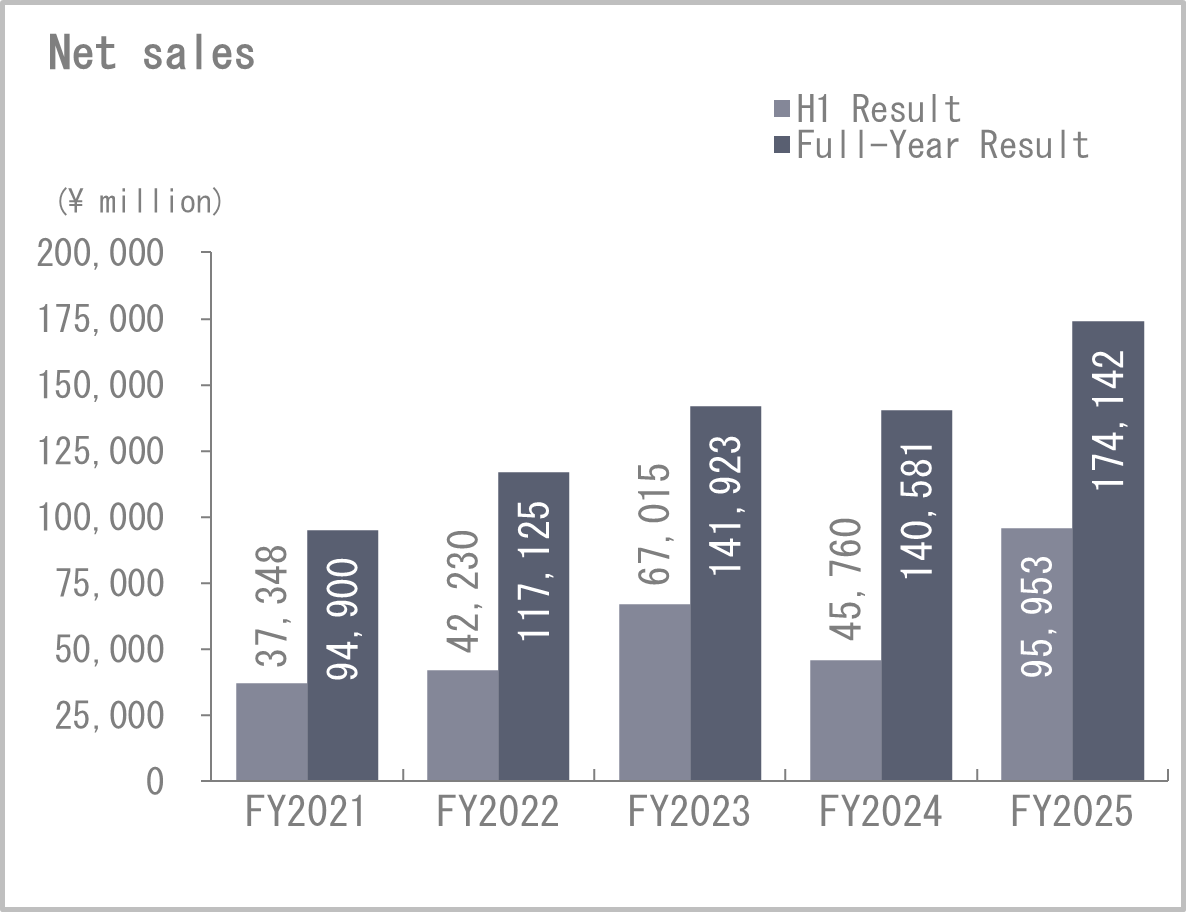
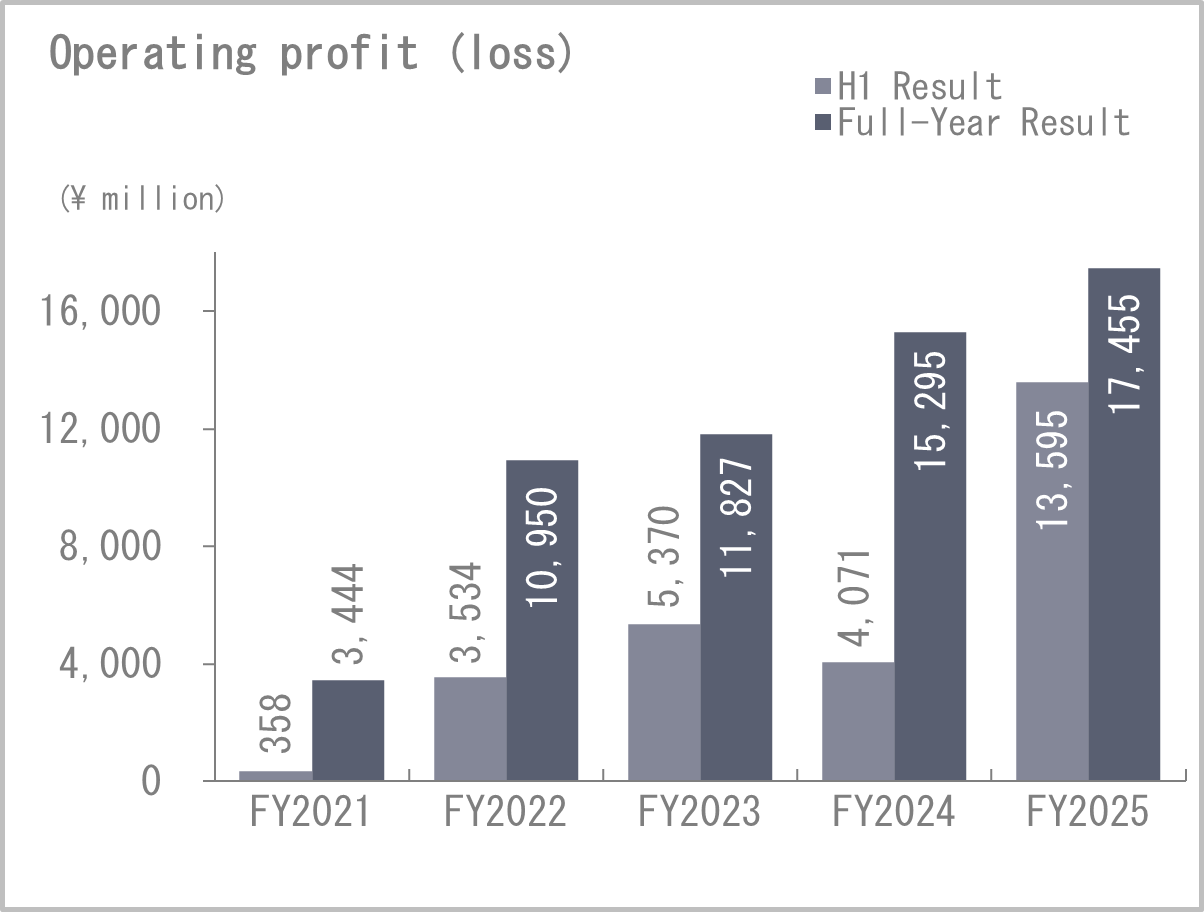
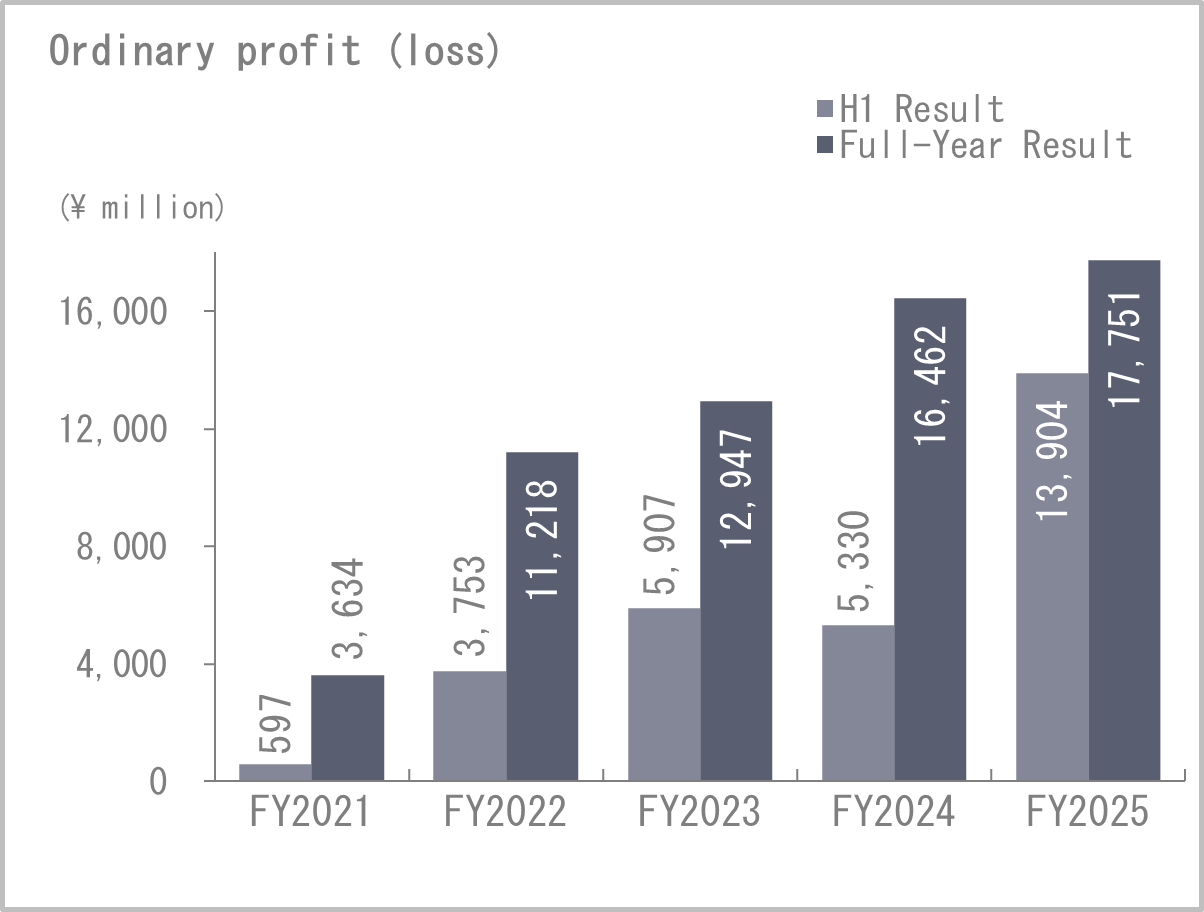
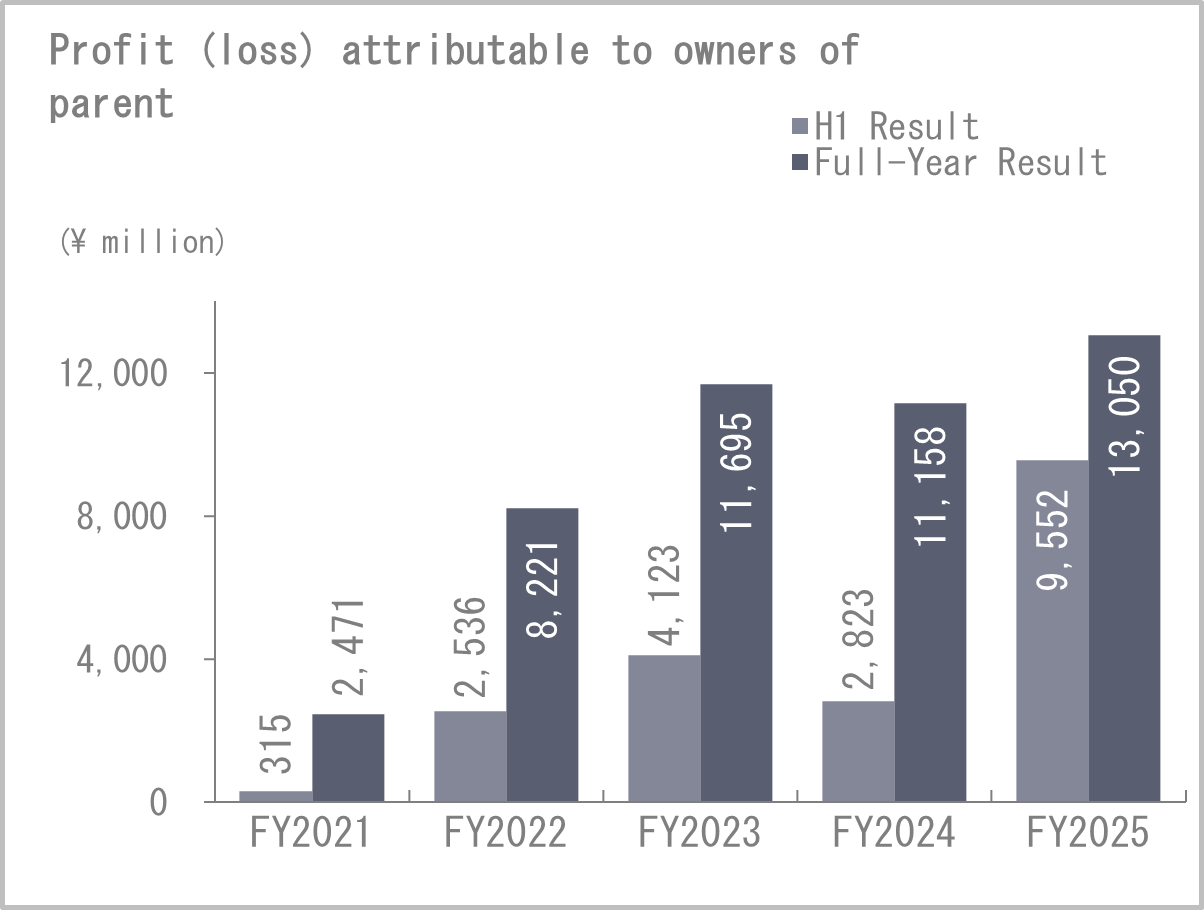
The below shows semiannual (key) financial figures for five business years.
For details of financial data, please refer to "Financial Data Sheets".
-
Consolidated
*The Company has applied the “Accounting Standard for Revenue Recognition” (ASBJ Statement No. 29, March 31, 2020) and other standards from the beginning of the FY2021.
*Figures for the year ended March 31, 2024 (full-year) reflect the “Accounting Standard for Current Income Taxes (ASBJ Statement No. 27, October 28, 2022)” and others.
Furthermore, the Company has finalized the provisional accounting for the business combination,
and the figures for the fiscal year ended March 31, 2024 have been adjusted to reflect this finalization.
Key financial figures
| (Unit: Millions ofyen) | Year Ended March 31, 2022 |
Year Ended March 31, 2023 |
Year Ended March 31, 2024 |
Year Ended March 31, 2025 |
Year Ended March 31, 2026 |
|||||
|---|---|---|---|---|---|---|---|---|---|---|
| H1 | Full-Year | H1 | Full-Year | H1 | Full-Year | H1 | Full-Year | H1 | Full-Year | |
| Net sales | 37,348 | 94,900 | 42,230 | 117,125 | 67,015 | 141,923 | 45,760 | 140,581 | 95,953 | 174,142 |
| Operating profit (loss) | 358 | 3,444 | 3,534 | 10,950 | 5,370 | 11,827 | 4,071 | 15,295 | 13,595 | 17,455 |
| Ordinary profit (loss) | 597 | 3,634 | 3,753 | 11,218 | 5,907 | 12,947 | 5,330 | 16,462 | 13,904 | 17,751 |
| Profit (loss) attributable to owners of parent | 315 | 2,471 | 2,536 | 8,221 | 4,123 | 11,695 | 2,823 | 11,158 | 9,552 | 13,050 |
| Share capital | 7,948 | 7,948 | 7,948 | 7,948 | 7,948 | 7,948 | 7,948 | 7,948 | 7,948 | 7,948 |
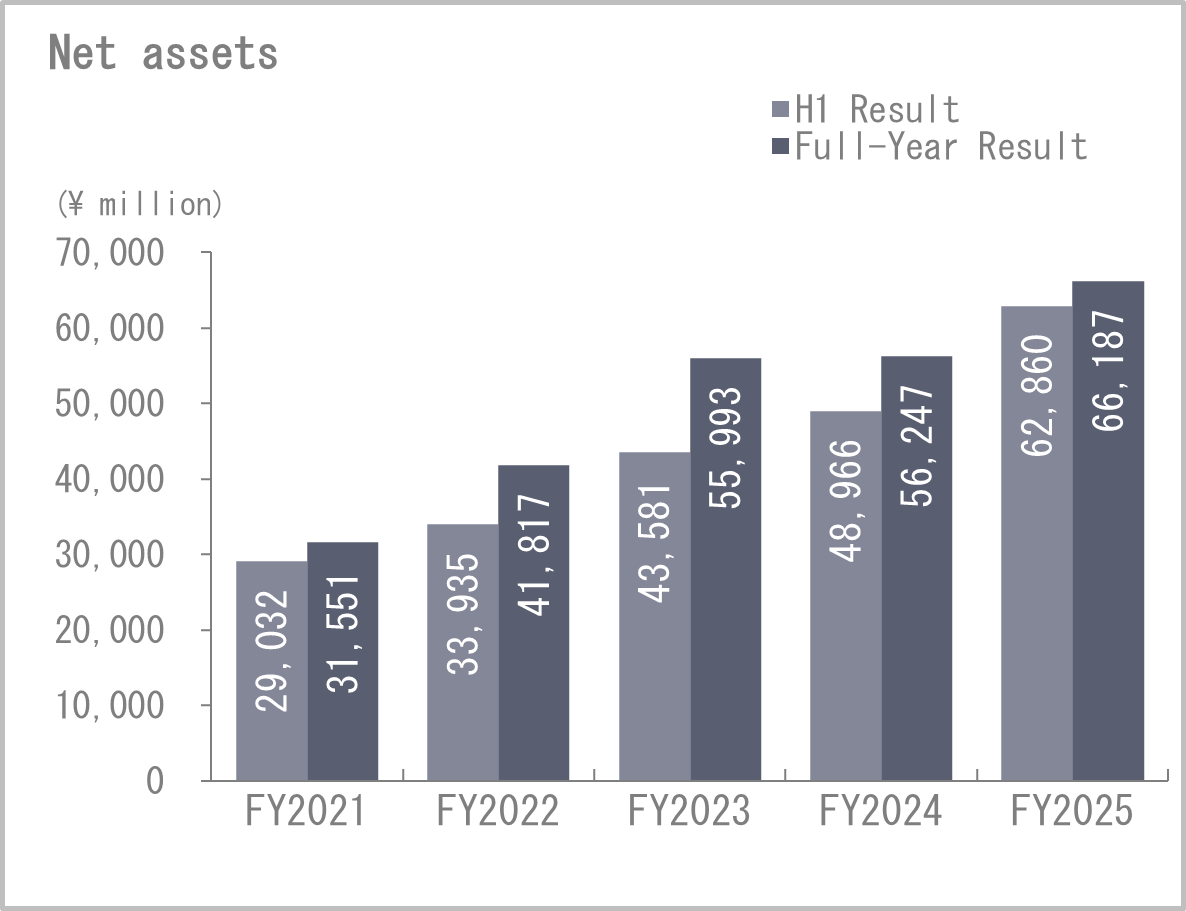
| Net assets | 29,032 | 31,551 | 33,935 | 41,817 | 43,581 | 55,993 | 48,966 | 56,247 | 62,860 | 66,187 |
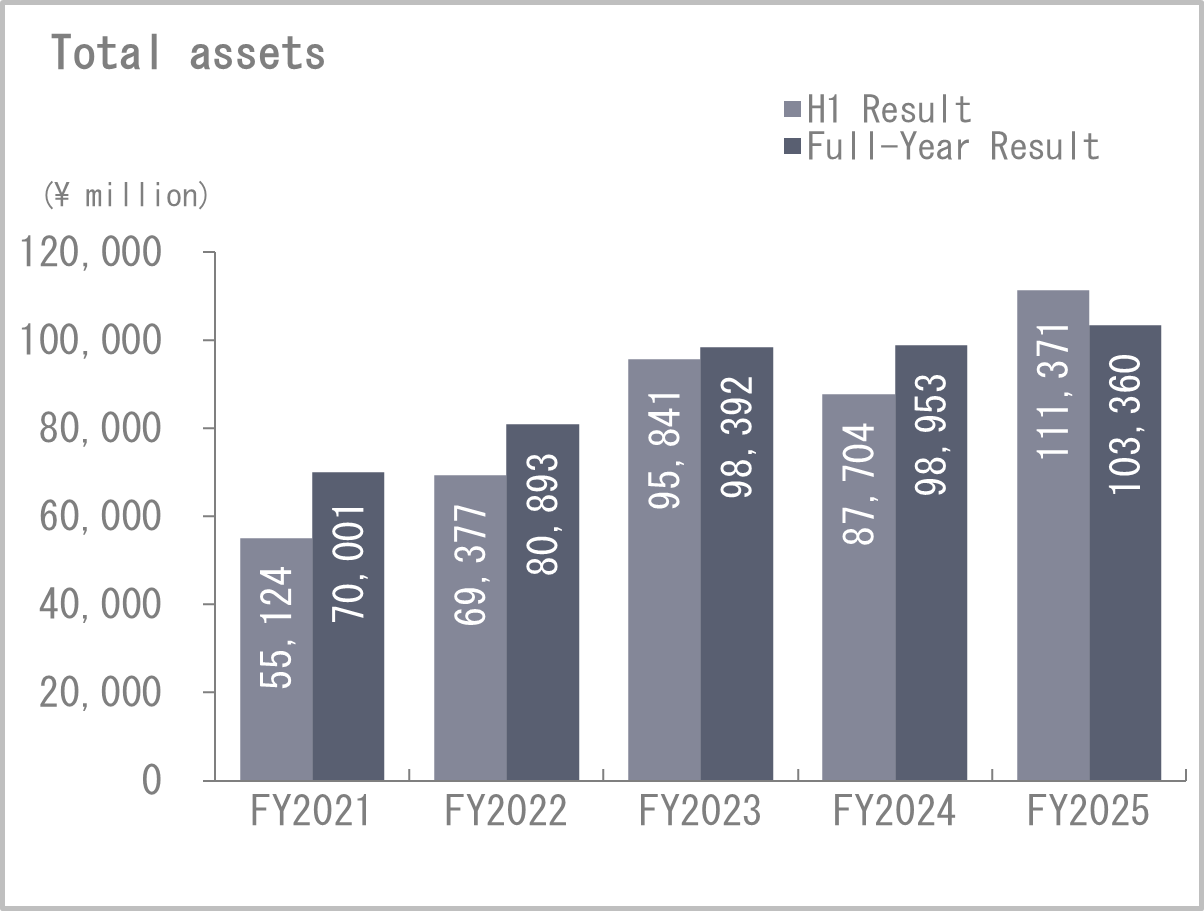
| Total assets | 55,124 | 70,001 | 69,377 | 80,893 | 95,841 | 98,392 | 87,704 | 98,953 | 111,371 | 103,360 |
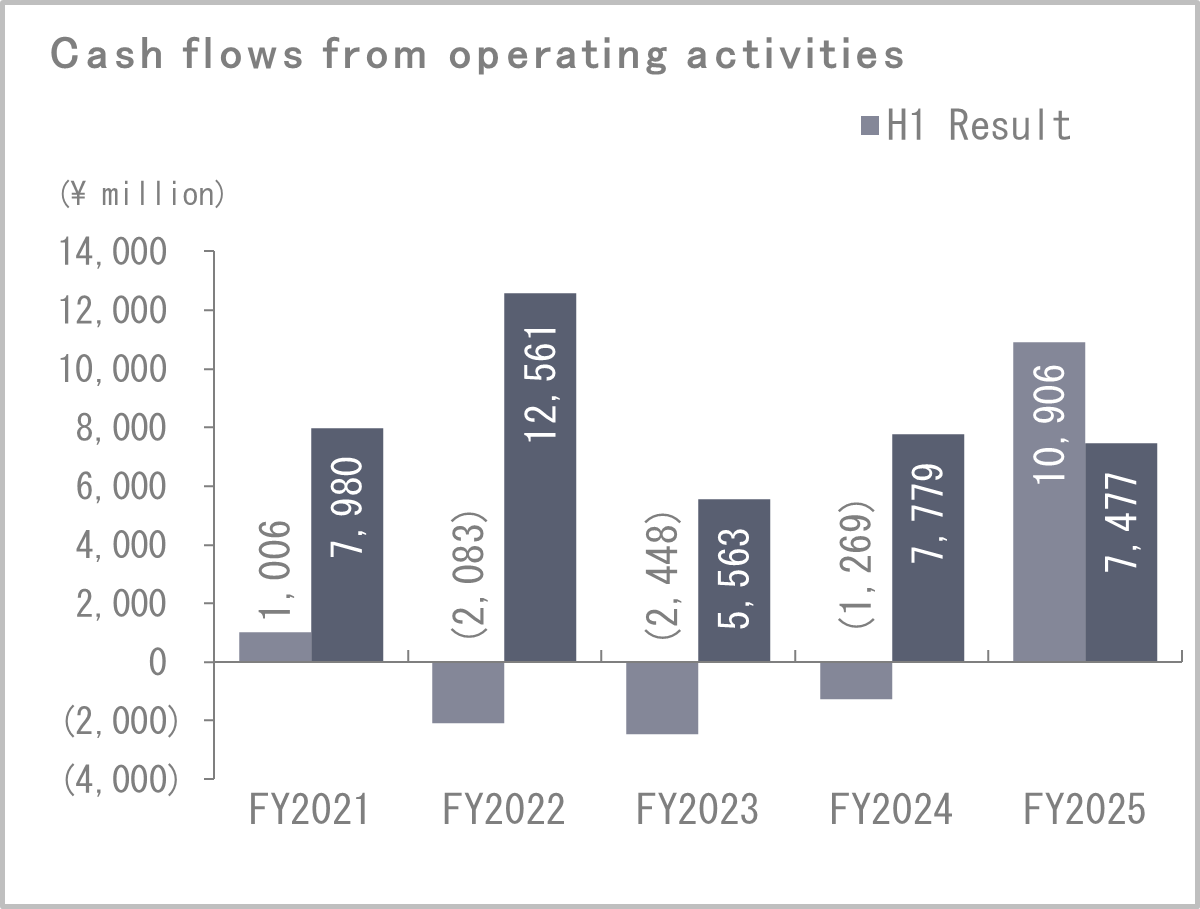
| Cash flows from operating activities | 1,006 | 7,980 | (2,083) | 12,561 | (2,448) | 5,563 | (1,269) | 7,779 | 10,906 | 7,477 |
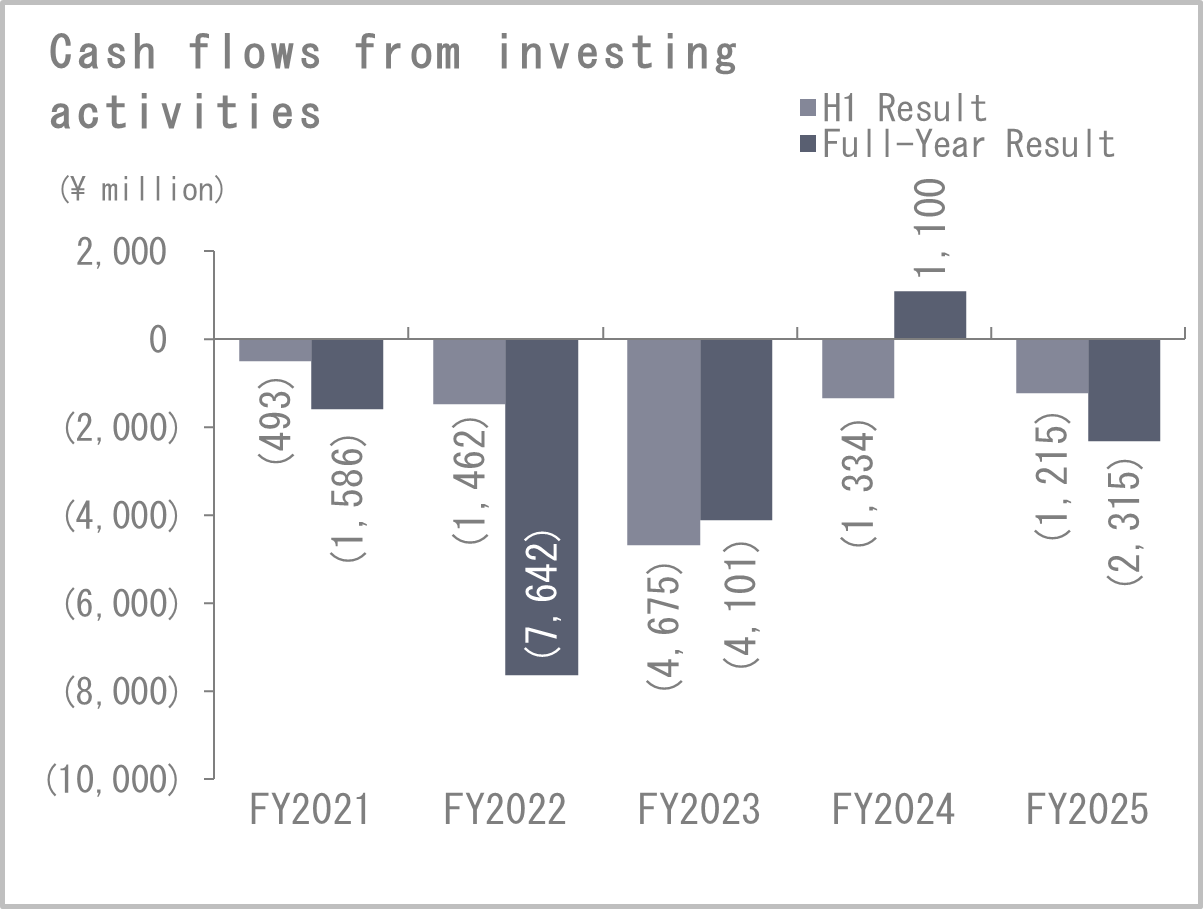
| Cash flows from investing activities | (493) | (1,586) | (1,462) | (7,642) | (4,675) | △4,101 | (1,334) | 1,100 | (1,215) | (2,315) |
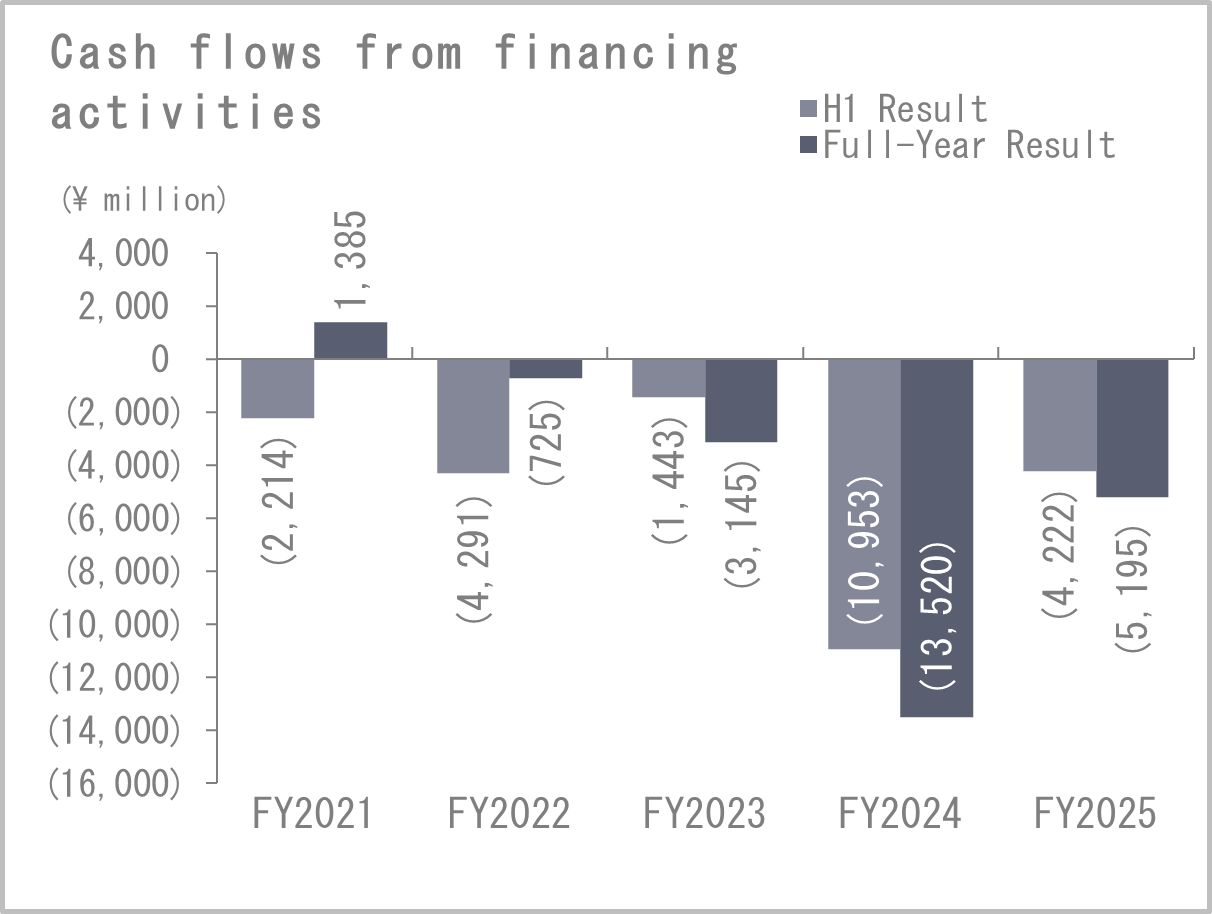
| Cash flows from financing activities | (2,214) | 1,385 | (4,291) | (725) | (1,443) | △3,145 | (10,953) | (13,520) | (4,222) | (5,195) |
| Cash and cash equivalents at end of period | 22,822 | 32,304 | 24,467 | 36,497 | 27,929 | 34,814 | 21,258 | 30,854 | 36,332 | 30,835 |